The Full Cost of AI from Development to Daily Use
AI budgets depend on the work a system performs and the resources it needs to deliver an acceptable result. Four visuals show how those costs change with scale and over time.
Model prices and the project budget
Stanford's 2025 AI Index reports that inference prices at roughly GPT-3.5 performance on the MMLU benchmark fell from $20 per million tokens in November 2022 to $0.07 in October 2024. The price fell by a factor of more than 280. The comparison tracks the price of achieving a similar benchmark score, so it does not measure the change in a company's full AI costs. [1]
A company can pay less for each model call and still spend more overall. As adoption grows, more tasks enter the system, and a single task may require several calls or human review before it produces an acceptable result. Those changes can outweigh a lower inference price.
Inference means running a trained model to produce an output, and tokens are the units used to meter much language-model input and output. A project budget also covers the initial build and the resources needed to operate the service over its expected life. The examples here focus on organizations adopting existing models, with customization where needed.
Initial investment and recurring costs
Development includes preparing data and testing whether the model performs the intended task. Deployment brings the system into production through software integration and infrastructure setup. Operations covers the work needed to maintain the service and monitor its performance.
Development and deployment can recur after launch. Teams may fine-tune a model when requirements change or run regression tests before releasing an update. Figure 1 separates the lifecycle stage from the timing of the expense.

Sculley and colleagues at Google documented these maintenance problems in their 2015 paper on technical debt in machine learning. Changes in upstream data and dependencies between systems can create work that a development budget misses. Their paper identifies the mechanisms involved, without estimating a maintenance cost share that applies to every project. [2]
Timing and accounting classification are separate questions. For the cash comparisons below, record capital expenditure when paid and do not add depreciation for the same assets. A broader total cost of ownership (TCO) estimate can allocate existing staff time and shared services, but that fully allocated view should remain distinct from the project's incremental cash requirements.
Cost per successful task
The unit of output needs a clear acceptance criterion. A customer service team might count a case resolved to its quality standard, while a document-processing team might count an extraction accepted after review. Apply the same criterion when comparing systems or tracking performance over time.
The FinOps Foundation distinguishes resource-efficiency metrics, such as cost per token, from business metrics, such as cost per case resolved. The first helps engineers track resource use. The second connects that spending to the result the organization needs. [3]
Total cost over T months = initial investment + sum of each month's fixed operating costs, variable costs, and periodic costs.
Average cost per successful task = total cost over T months / successful tasks over those same T months.
Fixed or committed operating costs remain broadly unchanged within a given capacity range, including staffing and reserved infrastructure. Variable costs increase with workload and can include inference charges and task-specific review effort. Periodic costs cover events such as an upgrade that is not already included in the operating budget.
Costs from failed attempts and rework stay in the numerator even when they produce no accepted result. If 100 submitted tasks cost $10 and only 80 pass review, the variable cost is $0.125 per successful task before any fixed costs are allocated. Each task should include the cost of its retries, and each accepted result should be counted once.
Economies of scale and capacity costs
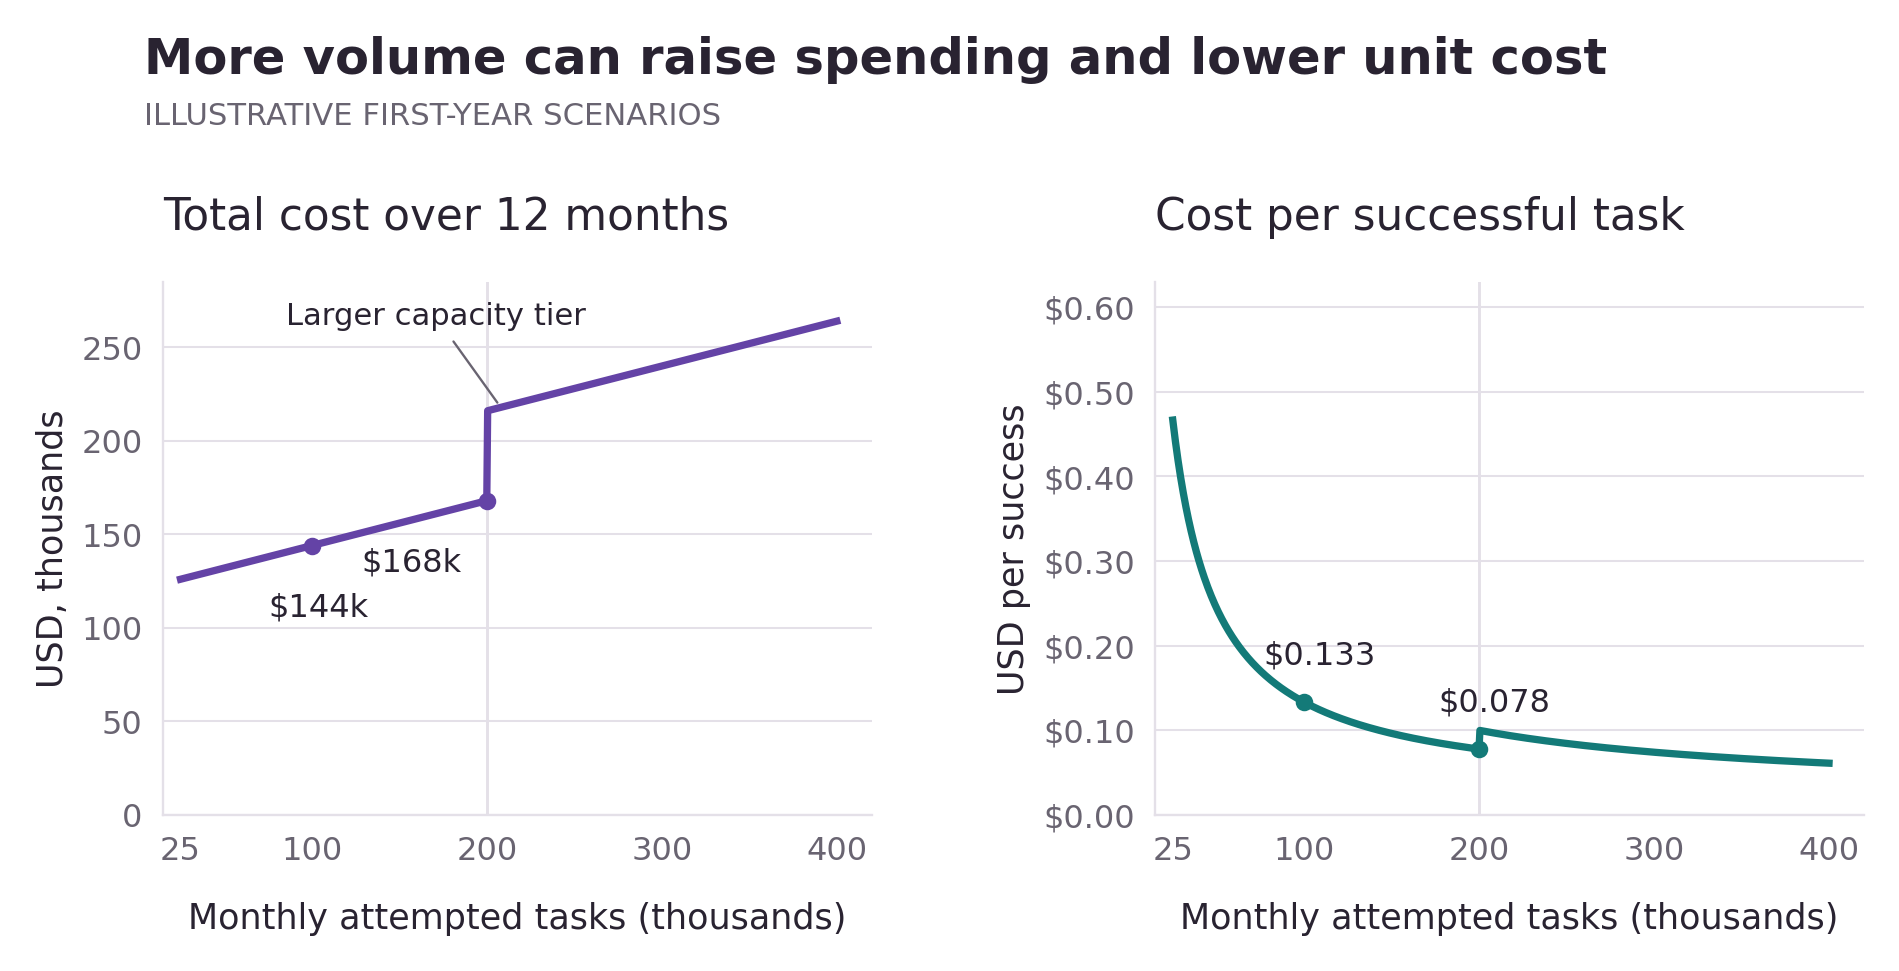
Consider a hypothetical service with a $60,000 initial investment and fixed operating costs of $5,000 a month at its first capacity tier. Variable cost averages $0.02 per submitted task, including any retries, and 90% of tasks pass review. Each scenario in Figure 2 holds its monthly workload constant for a year.

At 100,000 attempts each month, first-year spending reaches $144,000 and the system produces 1.08 million successful tasks. Average cost is about 13.3 cents per success. At 200,000 monthly attempts, spending rises to $168,000 while average cost falls to about 7.8 cents.
These economies of scale come from spreading the initial investment and fixed operating costs across more completed work. The chart assumes a step cost of $4,000 a month when demand exceeds 200,000 tasks. Unit cost rises at that threshold, then falls as volume increases within the new capacity tier.
Average cost and marginal cost answer different questions. Average cost includes a share of the initial build, while marginal cost measures the additional cost of serving more work. An expansion decision should account for any new capacity commitment and exclude sunk costs that the decision cannot change.
Capacity utilization
Workload volume measures how much work the service processes. Capacity utilization measures the share of available capacity that the workload uses. Provisioning for occasional peaks can leave much of that paid capacity idle during quieter periods.
For a simple illustration, suppose committed hosting costs $3,000 a month and can support one million attempted tasks at the chosen service target. At 25% utilization and a 90% success rate, that hosting component costs $13.33 per 1,000 successful tasks. At 75% utilization, it falls to $4.44 without changing the monthly commitment.

AWS recommends sizing hosted model infrastructure to the workload and shutting down instances during unused periods when the service permits it. Its guidance supports testing the demand profile before committing to capacity. AWS sells cloud services, so this is vendor guidance rather than an independent comparison of providers. [4]
A service needs enough headroom to handle bursts and failures while meeting its service-level objectives, such as response-time and availability targets. A purely usage-based API generally leaves idle-capacity costs with the provider. Minimum spending commitments or provisioned throughput can shift part of that risk back to the customer.
API services and self-hosting over time
Buying inference through a managed API and operating a model on your own infrastructure create different cost structures. AWS recommends comparing feasible hosting options against latency, throughput, and response-quality requirements. Latency measures response time, while throughput measures the rate of work the service can handle. [5]
| Illustrative assumption | Managed API | Self-hosted model |
|---|---|---|
| Initial investment | $20,000 | $60,000 |
| Fixed operating cost per month | $1,000 | $3,000 |
| Variable cost per attempted task | $0.06 | $0.01 |
| Attempts per month | 100,000 | 100,000 |
| Monthly operating cost | $7,000 | $4,000 |

In this scenario, the API costs $104,000 over 12 months, compared with $108,000 for self-hosting. Over 36 months, the totals become $272,000 and $204,000. The preferred option therefore depends on the period being evaluated.
This cost crossover depends on the assumptions in the table. Lower demand or additional engineering costs could delay it or prevent it altogether. A migration analysis should include switching costs and compare future avoidable spending, treating completed development work as a sunk cost.
Serving software can affect how much work the same hardware supports. In their 2023 PagedAttention paper, Kwon and colleagues reported that vLLM delivered two to four times the throughput of the comparison systems at similar latency in their evaluations. Those results apply to the tested configurations and do not establish an equivalent reduction in total project cost. [6]
Workload and service requirements
The workload mix matters as much as the number of tasks. A short classification request and an analysis of a long document can require very different amounts of computation. For an agent that makes several model or tool calls, measure cost across the complete workflow.
Anthropic's pricing documentation lists different rates for input and output tokens, with separate charges for cache writes and reads. As checked on October 5, 2026, its Batch API offers a 50% discount on eligible input and output token charges for asynchronous processing. That discount reduces the token bill, with its effect on total project cost depending on the share of spending those charges represent. [7]
Batch inference suits work that can wait for completion, while an interactive service may need an immediate response. Prompt caching reuses previously processed input, with savings depending on cache hits and write charges. Model routing can send simpler tasks to a smaller model, provided evaluation confirms that it meets the acceptance criteria.
Service requirements affect the budget too. Access controls and data retention can add engineering or storage costs, while human review adds labor. Compare options against the same requirements so a lower cost does not simply reflect a reduced level of service.
Building and updating the forecast
A pilot should record the workload mix and link each task to its model calls and final review outcome. Measure rework time and the proportion of tasks that require human intervention. Those observations give the forecast a firmer basis than a token-price comparison alone.
The monthly forecast should separate initial investment from recurring operating costs and put planned upgrades in the months when they occur. Allocate shared services once, then reconcile the estimates with invoices and recorded staff time. State whether the comparison uses nominal or constant dollars and how it treats discounting and equipment replacement.
Sensitivity analysis identifies the assumptions that most affect unit cost. If the acceptance rate falls from 90% to 75% with attempted volume and spending unchanged, cost per successful task rises by 20%. A cheaper model therefore needs testing for both its inference cost and its acceptance rate.
An adoption forecast should reflect how quickly users are likely to begin using the service. Infrastructure commitments may start before demand reaches the expected level, and peak traffic can grow faster than average usage. Separate the launch period from steady operation so an annual average does not conceal either cost.
Evaluators and domain experts can improve these estimates by defining acceptance criteria and measuring the effort needed to correct failures. Operations teams can trace expensive retries to particular task types or software changes. For people doing AI work, documenting those findings shows how their judgment affects production costs.
The final comparison should report total cost alongside cost per successful task. Neither measure establishes return on investment without an estimate of the value delivered and a comparison with the next-best alternative. Together, they show what the service costs to operate and how that spending changes as the work grows.
Sources and research notes
Research checked October 5, 2026. Numerical scenarios and charts are BIJ2 AI calculations using stated hypothetical assumptions. They are not market quotations or observed deployment results.
- Stanford HAI, 2025 AI Index, Research and Development. Historical inference-price comparison at an MMLU score of 64.8, for November 2022 and October 2024. It does not measure enterprise total cost of ownership.
- Sculley and colleagues, Hidden Technical Debt in Machine Learning Systems. NIPS 2015. Paper by Google researchers on system maintenance and technical debt.
- FinOps Foundation, Unit Economics. Practitioner guidance distinguishing technical efficiency from business outcome measures.
- AWS Generative AI Lens, Optimize resource consumption to minimize hosting costs. Vendor guidance on workload patterns, infrastructure sizing, and resource consumption.
- AWS Generative AI Lens, Balance cost and performance when selecting inference paradigms. Vendor guidance on hosting comparisons under performance requirements.
- Kwon and colleagues, Efficient Memory Management for Large Language Model Serving with PagedAttention. SOSP 2023. Primary research on memory management and serving throughput. Reported gains are specific to the study's evaluations.
- Anthropic, Claude Platform pricing documentation. Vendor pricing terms for token categories, caching, and batch processing, checked October 5, 2026.