Research and Analysis
Measuring AI’s Economic Value
AI can change how much work people complete, what that work costs, and the revenue it produces. Organizations need evidence of those changes to judge whether an AI investment pays off.
When a team finishes its work faster after adopting AI, managers still need to establish what happens to the time. Employees might serve more customers, replace contractor work, reduce errors, or finish earlier. The financial result depends on what the organization would otherwise have spent or earned.
Our companion article on AI costs explains how to budget for development, deployment, and operation. Here, we examine how analysts can estimate AI’s effects on work and determine whether those changes produce financial returns.
AI Value Map
Each topic connects a business claim to the evidence needed to assess it. Select a topic to read its explanation. The adjacent controls expand or collapse each branch.
The dashed line between Staff Capacity and Cash Savings marks the article’s central caution. Released staff time converts to cash savings only in part.
What Workplace Studies Measure
In Generative AI at Work, Erik Brynjolfsson, Danielle Li, and Lindsey Raymond studied a phased rollout to 5,172 customer support agents. Their published analysis reports that agents resolved 15% more issues per hour on average, although gains differed across workers. That outcome measures productivity in one service setting. A claim about payroll or return on investment would need separate evidence. [1]
Eleanor Dillon and colleagues conducted a field experiment with 7,137 knowledge workers across 66 firms. Among employees who received access to the tool, 80% used it. The authors report that those users spent two fewer hours on email each week during the second half of the six-month study. The researchers did not detect changes in the quantity or composition of tasks from providing AI to individual workers. The distinction matters when an organization expects time savings to produce additional output. [2]
METR found a different result in a 2025 randomized trial involving 16 experienced developers and 246 tasks in familiar open source projects. Allowing AI tools from early 2025 increased completion time by 19%. In a February 2026 follow-up, METR reported that participant selection and difficulties measuring concurrent agent use made its newer estimates unreliable indicators of the current effect. METR expects those problems to understate AI’s benefit, because developers who rely most on AI declined to participate or withheld tasks suited to it. Neither result supplies a universal multiplier for a business forecast. [3] [4]
These studies examine different people, tasks, tools, and outcomes. Each organization needs to test whether the findings apply to its own employees and workflows. Averaging the studies’ headline percentages would obscure what each study measured.
The Baseline and Comparison Group
The baseline describes what would happen without the proposed AI deployment. It might involve the current workflow, conventional automation, or additional staff to meet rising demand. A sound comparison covers feasible alternatives over the same period and documents expected changes in workload, prices, and service standards.
A simple comparison of results before and after adoption can assign unrelated improvements to AI. Suppose employees in an AI group complete ten cases per hour before adoption and thirteen afterward, while a comparison group increases its rate from ten to eleven. All cases meet the same quality standard. Subtracting the changes produces an estimated effect of two additional cases per hour. The full increase of three includes the improvement that the comparison group also achieved.
Observed Change and the Comparison Trend

Where feasible, an organization can randomize access or rollout timing. Researchers can assign individuals or teams, depending on whether employees might share AI outputs with colleagues in the comparison group. Outcomes should be defined in advance, with a plan for missing data and nonuse. HM Treasury’s AI evaluation guidance recommends considering experimental methods early and explaining the comparison clearly. [5]
When randomization is unavailable, difference in differences compares outcome changes across groups. Its causal interpretation requires assumptions about how outcomes would have evolved without treatment. Similar trends before treatment can inform that judgment, but they cannot prove it. For rollouts across several dates, methods such as Callaway and Sant’Anna’s estimate a separate effect for each adoption group and period. [6]
Three Models an Organization Can Test
Evaluators need to link assignment and usage records to task logs, quality reviews, invoices, and sales records. Each record should match the workers, teams, or business units in the study. Each proposed benefit needs an observable outcome and a defined measurement period.
A spreadsheet can organize the financial calculation. The empirical model tests whether AI changes an outcome and estimates the size of that change. The resulting estimate, its uncertainty, and explicit rollout assumptions then become inputs to the spreadsheet. The calculation cannot establish causation on its own.
| Question | Outcome to measure | What the result can establish |
|---|---|---|
| Does AI improve productivity? | Accepted work per paid labor hour, with error and rework measures | A change in output relative to labor input, subject to the study design |
| Does AI reduce spending? | Overtime, contractor invoices, and other avoidable cash outlays | A financial saving attributable to the deployment |
| Does AI generate additional business? | Contribution per eligible lead or customer over a fixed period | Additional revenue less the incremental costs of serving it |
For a sales experiment, contribution per eligible lead includes leads that never purchase. Comparing only customers who bought would change the composition of the groups and could distort the result. Returns, discounts, fulfillment costs, and displacement of existing sales also affect the financial outcome.
A Simple Statistical Specification
For a randomized assignment, analysts can estimate Yi = α + βZi + εi, where i identifies a study unit, Z records assignment to AI access, and Y records the outcome. The intercept α represents the mean for the comparison group, β estimates the effect of offering access, and ε represents variation that assignment does not explain. Analysts can add characteristics such as prior performance to improve precision. Uncertainty belongs at the appropriate assignment level. Differences in dropout rates across groups also need examination.
Actual use is a separate variable. Comparing enthusiastic users with nonusers can introduce selection bias. If the assignment effect already includes nonuse, multiplying that effect by the same adoption rate again would understate the estimate. Estimating an effect among users requires additional identification assumptions.
Statistical significance is only one consideration. Even when researchers estimate a gain precisely, that gain may be too small to cover deployment costs. A wider uncertainty interval may leave both a worthwhile benefit and a loss plausible. Managers need to weigh that uncertainty against the cost of expanding the deployment.
How Teams Use the Time AI Saves
Time savings give managers an opportunity to change production or spending. Whether the organization can use that opportunity depends on demand, scheduling, staff capabilities, and constraints elsewhere in the workflow. A team that saves five minutes on each task may still need the same number of employees to cover its shifts.
In this hypothetical example, AI frees 200 staff hours each month after employees complete review and rework. Managers use 50 hours to replace contractor work, 100 hours to support additional sales, and 50 hours to reduce a backlog. Figure 2 assigns every hour once.
Allocation of Staff Time

If the organization would otherwise pay a contractor $40 per hour, it saves $2,000. Suppose a separate sales evaluation supports $3,000 of additional contribution after incremental fulfillment costs, and employees can handle that business within the 100 hours available. The example records backlog reduction as a service outcome without assigning it a dollar value.
At $40 per hour, analysts could value all 200 hours at $8,000. That estimate expresses the value of staff time, and the organization receives no additional $8,000 in cash. Adding that amount to the contractor saving and sales contribution would count the same operational improvement more than once. The government’s digital benefits framework also warns against counting overlapping benefits. [7]
Monthly Net Cash Benefit

Existing staff time still has an opportunity cost. An appraisal can estimate the value of work that employees forgo when they use their time elsewhere. That valuation needs an explanation and a check on whether the output measures already capture it. A cash forecast records when the organization pays or receives money. An economic appraisal can also include costs and benefits that involve no cash payment.
Adoption and the Timing of Returns
A pilot’s effect may change as employees learn, the workload expands, or the organization introduces new model versions. A forecast should specify who can use AI, what share of eligible work they use it for, and how effective that use becomes. License purchases alone do not answer those questions.
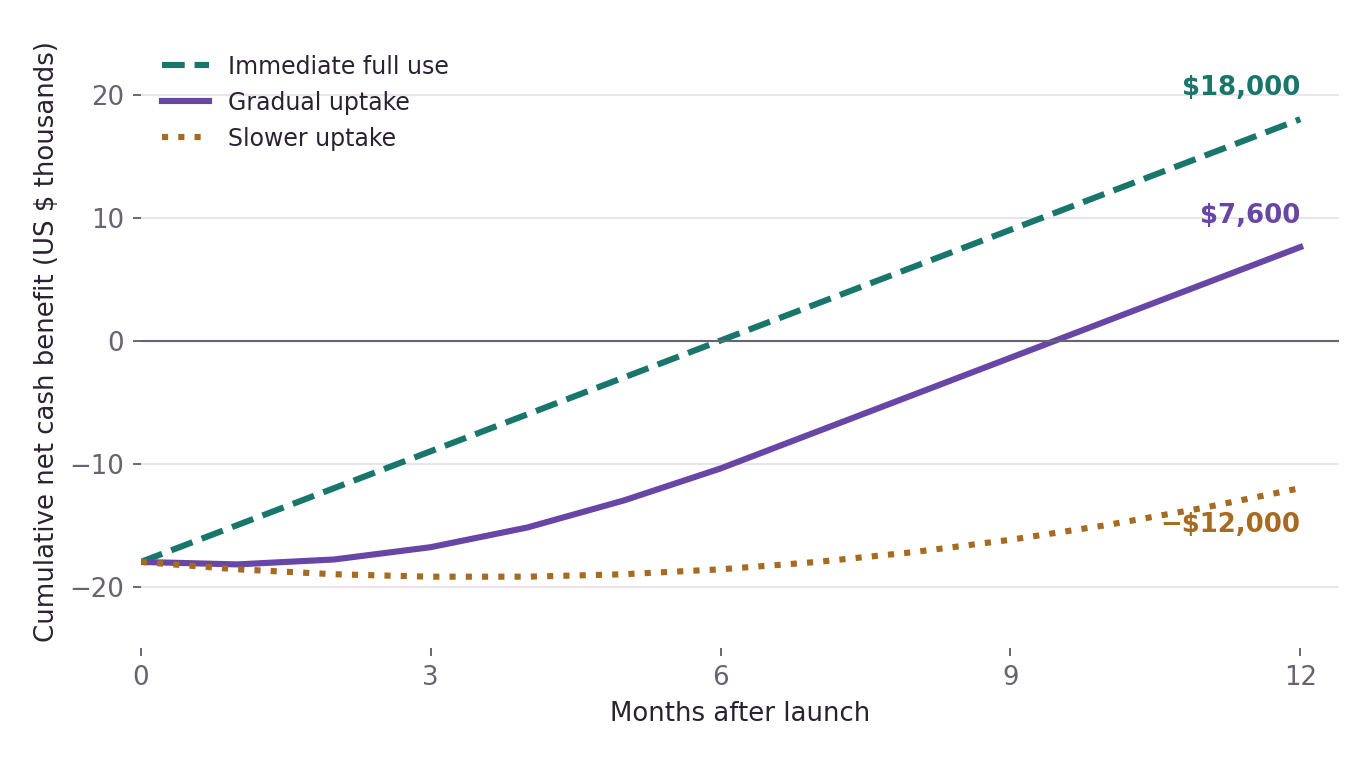
The example now includes an $18,000 initial investment. At full adoption, the organization gains $5,000 each month before paying $2,000 in operating costs. The calculation assumes that benefits increase in proportion to adoption. Monthly costs comprise $1,000 fixed plus $1,000 multiplied by the adoption rate. These assumptions describe hypothetical scenarios.
Cumulative Returns Under Three Adoption Paths

Immediate full adoption produces an $18,000 net cash benefit by month twelve. Gradual uptake produces $7,600, while the slower path leaves a $12,000 shortfall. A report that shows only the monthly result at full adoption would conceal that difference.
Scenario Assumptions and Calculation
The variable at denotes the share of eligible work for which employees use AI in month t. Monthly net cash benefit equals $5,000at − ($1,000 + $1,000at). Cumulative net cash benefit equals the sum of those monthly values minus $18,000 at launch.
The immediate scenario sets adoption at 100% throughout. The gradual scenario sets adoption at 20%, 35%, 50%, 65%, 80%, and 90% in months one through six, then at 100% for the remaining months. The slower scenario starts at 10% and increases adoption by five percentage points each month to 65% in month twelve. All other assumptions remain constant.
In practice, benefits may not increase proportionately. A reduction in contractor spending may require a contract renewal, and payroll savings may require a staffing threshold. Faster production may also generate no additional sales when demand is weak. A good model represents those dependencies directly and tests the assumptions that change the decision.
For longer horizons, analysts should discount future cash flows consistently with the organization’s appraisal method. Their cost estimates should include transition work, evaluation, training, and any additional security checks or human review that the deployment requires. Adding depreciation to a cash model that already records the asset purchase would count the same cost twice.
AI Return Scenario Calculator
The calculator assumes that adoption increases evenly from the starting percentage to full use in the month you select. Benefits and usage costs rise with adoption. Fixed costs continue each month. The inputs describe a hypothetical deployment.
The organization pays this amount at launch.
Avoided spending and additional contribution, before AI costs.
This cost remains the same as adoption changes.
This cost increases in proportion to adoption.
Employees use AI for this share of eligible work.
Adoption reaches 100% in this month.
Cumulative Net Cash Benefit
The model assumes that the organization pays and receives cash in the month it incurs costs and earns benefits. It excludes taxes, discounting, and unplanned replacement costs.
Monthly Ledger
| Month | Adoption | Benefit | AI costs | Net cash | Cumulative |
|---|
Calculation
For each month, the calculator multiplies the benefit at full use by adoption. It then subtracts fixed costs and usage costs at that adoption level. Cumulative net cash benefit sums those monthly results and subtracts the initial investment once. Break-even marks the first month that ends with a nonnegative cumulative balance.
Forecast Validation and Measured Results
A forecast combines evidence with assumptions about future conditions. Analysts should preserve the original forecast and label which inputs came from experiments, observed operations, vendor estimates, or judgment. Predictions can then be compared with later data from periods or business units outside the data used to fit the model.
Prediction checks and causal evaluation answer different questions. A model can predict spending accurately without establishing that AI caused a saving. Conversely, a credible pilot can identify a local effect that fails to transfer to a larger rollout.
When results differ from the forecast, analysts should investigate adoption, task mix, review time, demand, and model changes separately. Invoices and payroll show whether savings actually occurred, and sales records show whether additional sales cover the incremental costs of serving customers. Recording the tool version and workflow helps analysts distinguish changes in the technology from changes in how employees use it.
A financial calculation may leave out outcomes that matter to employees and customers. Evaluators should also examine workload, customer experience, service failures, and access to services. Reports can present those outcomes alongside the cash estimate even when no defensible price exists for them. Employees completing tasks faster does not, by itself, establish that customers receive better service.
Managers can use this evidence to decide whether to expand the deployment or change the workflow. If the expected benefits do not materialize, the original forecast and subsequent measurements help them identify which assumptions failed and whether continued spending has a defensible basis.
Sources and Research Notes
BIJ2 AI reviewed these sources on October 6, 2026. The worked examples and all four figures use the hypothetical assumptions that this article describes.
- Brynjolfsson, E., Li, D., and Raymond, L. Generative AI at Work. Quarterly Journal of Economics, 2025, 140(2), 889–942. The authors’ Stanford summary reports 5,172 agents and the 15% productivity estimate. Earlier working paper versions used different figures.
- Dillon, E., Jaffe, S., Immorlica, N., and Stanton, C. Shifting Work Patterns with Generative AI. The publisher listed the article as forthcoming in American Economic Review: Insights when we checked. The researchers randomized access across 66 firms. The email result applies to employees who received access and used the tool.
- METR. Measuring the Impact of Early-2025 AI on Experienced Open-Source Developer Productivity. July 10, 2025. The researchers randomized AI access by task among experienced developers working on familiar projects.
- METR. We Are Changing Our Developer Productivity Experiment Design. February 24, 2026. METR explains how participant selection and time measurement complicate its follow-up study.
- HM Treasury and the Evaluation Task Force. Guidance on the Impact Evaluation of AI Interventions. The publisher updated this guidance on May 15, 2026. It covers baselines, experimental designs, and changes to AI interventions during evaluation.
- Callaway, B., and Sant’Anna, P. H. C. Difference-in-Differences with Multiple Time Periods. Journal of Econometrics, 2021, 225(2), 200–230. The authors develop estimators for varying treatment dates and heterogeneous effects under stated identification assumptions.
- Department for Science, Innovation and Technology and Government Digital Service. Digital and Data Benefits Framework. April 7, 2026. The framework explains how analysts can define benefits, avoid overlap, and test sensitivity to assumptions.